
The average North Yorkshire home cost £270,569 in June, up £8,078 in a year. Semis rose fastest at 4%, flats barely moved, and prices have eased since November.
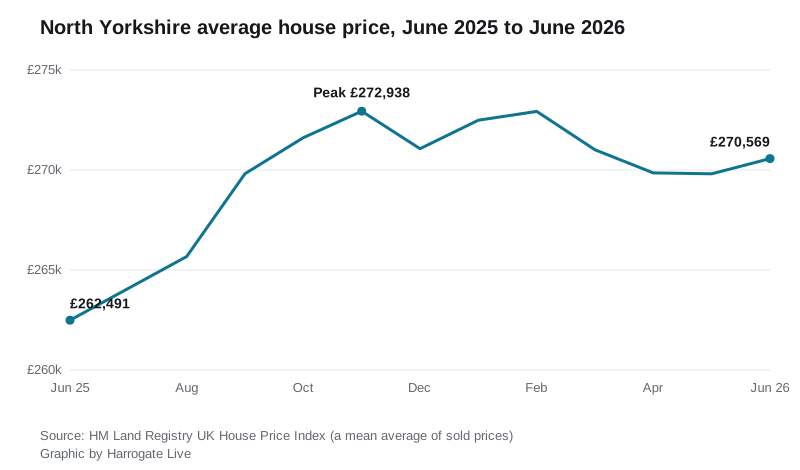
The average North Yorkshire home sold for £270,569 in June, according to HM Land Registry’s UK House Price Index, published on 7 September. That is £8,078 more than the £262,491 of a year earlier, a rise of 3.1%.
The year splits into two halves, though. Prices climbed steadily through the autumn to a peak of £272,938 in November 2025. Since then they have drifted gently down, and June’s figure is £2,369 below that peak. The month itself was quiet: up 0.3% on May.
Semis are rising fastest, flats barely at all
The county average hides a clear ranking by property type. Over the year to June:
- Semi-detached: £270,358, up 4.0%. The fastest riser in the county.
- Terraced: £218,729, up 3.8%.
- First-time buyer homes: £218,625, up 3.6%.
- Detached: £433,551, up 2.6%.
- Flats and maisonettes: £143,005, up 0.7%. Barely moving.
The pattern favours the middle of the market. The homes most families trade up to rose at twice the pace of detached houses, while flats, the usual first rung, added almost nothing.
How the county compares with its neighbours
North Yorkshire’s 3.1% sits in the middle of the pack, on the same index for June:
- York: £309,611, up 4.8%. Still the most expensive market nearby.
- Leeds: £249,394, up 5.9%.
- West Yorkshire: £211,101, up 6.0%.
- England: £293,262, up 1.8%.
The cheaper markets to the south and west are rising faster, and England as a whole is rising slower. North Yorkshire remains dearer than Leeds and West Yorkshire but cheaper than York and the England average.
What it means for you
If you are selling a semi or a terrace, the past year has been on your side. If you are buying, the drift since November means the market has not run away since the winter, and June’s average is roughly where December’s was.
For first-time buyers, the entry price across the county is £218,625 on this index. Cash buyers paid less than mortgaged buyers on average: £265,349 against £274,469.
Two health warnings. This is the county-wide figure for North Yorkshire, the largest council area in England, so it blends Harrogate with markets from Skipton to Whitby. Harrogate town itself trades well above the county line: our Harrogate house prices page tracks the town-level sold prices. And the UKHPI figure is a mean average, not a median, so a handful of very expensive sales can pull it upwards.
The index is built from completed sales registered with HM Land Registry, and back months are revised as late registrations arrive. The July figure is due in mid-October.
Update, 24 September 2026. Two corrections to the piece above, which we are noting rather than rewriting. First, the July figure was published on 17 September, not in mid-October as we said. Second, HM Land Registry has revised June upwards as late registrations came in: the county average for June now reads £271,682, not the £270,569 published on 7 September, and the annual rise for June is now 3.5%, not 3.1%. On the revised series, July’s average was £270,463, down £1,219 on June, with annual growth slowing to 2.5% (UKHPI, North Yorkshire, July 2026). Back months are revised every release, so treat any single month as provisional.
Have your say