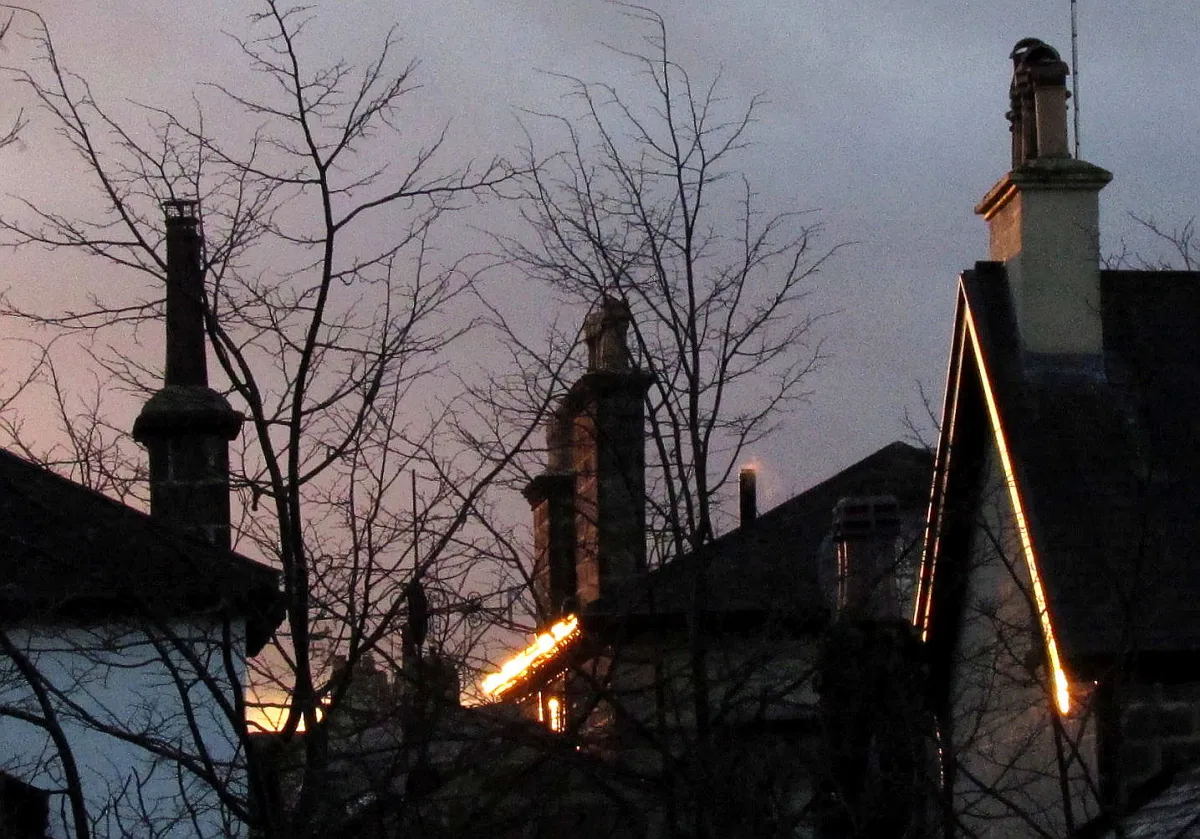

The average Harrogate home sold for £397,640 (Land Registry sales to April 2026). Prices by type, the £2.3m lane, and why the official index says £270,320.
Asking prices in agents’ windows tell you what sellers hope for. The figure that matters is what Harrogate homes actually change hands for, which HM Land Registry records once every sale completes. This page is a plain read of those sold-price numbers: the town average, which way it is moving, what each property type costs, the most expensive corners, and why the official index quotes a much lower figure that is not really about Harrogate at all.
The quick answer
The average sold price for a property in Harrogate is £397,640, based on Land Registry sold-price records for the year to April 2026. Prices over that year were about 3% down on the year before, and roughly 1% below the town’s 2023 peak of £403,357. In other words, the market has come off the boil gently rather than fallen: Harrogate homes are trading at close to their all-time high, just without the bidding heat of 2021 and 2022.
Zoom out to the HG postcode area, which takes in Knaresborough, Ripon, Boroughbridge and Pateley Bridge as well as Harrogate itself, and the picture is steadier still: an average of £396,000 in the year to June 2026, up about £5,400 (1%) on the year, on roughly 2,000 sales (Plumplot, from Land Registry data). Sales volumes were down about 24% year on year, so fewer homes are changing hands, but the ones that sell are holding their value.
Why the official index says £270,320
Look Harrogate up on the official UK House Price Index and you will see a much lower average: £270,320 in May 2026, up 2.6% in a year. That is not a contradiction, it is a boundary. Since April 2023 Harrogate has been part of the single North Yorkshire unitary council, the largest council area in England, so the official local-authority index now averages everywhere from Skipton to Whitby, including much cheaper towns and villages. Harrogate itself sits well above that county-wide figure. Both numbers are real; they just measure very different areas, so always check the geography before you compare.
| Area | Average price | Period |
|---|---|---|
| Harrogate town (sold prices) | £397,640 | Year to April 2026 |
| HG postcode area (incl. Ripon, Knaresborough) | £396,000 | Year to June 2026 |
| North Yorkshire (official UK HPI) | £270,320 | May 2026 |
| England (official UK HPI) | £292,095 | May 2026 |
The England average was £292,095 in May 2026, up 2.3% over the year (UK HPI), so a typical Harrogate home costs roughly £100,000 more than a typical English one.
What each property type costs
Within Harrogate town, the spread by type is wide. From the same Land Registry sold-price records for the year to April 2026:
- Detached houses: £677,667 on average, the family-home end of the market on the Duchy estate, around Fulwith and on the southern fringes.
- Semi-detached houses: £371,390, and semis were the most-sold property type in Harrogate over the year, which tells you what the town’s stock mostly is.
- Terraced houses: £293,586, the main route in for buyers who want a house rather than a flat.
Across the wider HG postcode area, Plumplot puts flats at around £252,000, detached at £635,000, semis at £350,000 and terraces at £293,000 for the year to June 2026.
First-time buyers and home movers
The official index for North Yorkshire splits buyers usefully, even if the geography is county-wide. In May 2026 a first-time buyer paid an average of £218,170 (up 2.7% on the year) while a home mover paid £320,405 (UK HPI, North Yorkshire). In Harrogate itself both rungs sit higher, but the gap between them, roughly the cost of the step up from a first flat or terrace to a family house, is the same story.
The most expensive streets
Harrogate’s priciest addresses cluster south of the Stray and around the Duchy estate. From Land Registry sold-price records compiled by Property Solvers:
- Fulwith Mill Lane (HG2), off the Leeds road on the town’s southern edge, averages about £2.37 million, the most expensive street in Harrogate.
- Swan Road (HG1), beside Valley Gardens and the Old Swan Hotel, averages about £1.97 million.
- Firs Road (HG2) averages about £1.8 million.
At sector level, Plumplot puts HG2 9, the south Harrogate side that includes Fulwith, as the most expensive postcode sector at an average of £706,000, while HG1 1 in the town centre, where the stock is mostly flats and apartments, is the most affordable at £243,000. The cheapest recorded streets are central flat conversions such as Station Square, averaging under £100,000.
What it means for you
If you are selling, the market is steady rather than hot: prices are a touch below the 2023 peak and about a quarter fewer homes changed hands over the last year, so realistic pricing matters. Property Solvers’ data shows the average Harrogate listing takes about 124 days from listing to completion and sellers who cut their asking price gave up about £10,800 (2%) on average. If you are buying, flats are the soft spot (down 0.8% over the year county-wide, the only falling type), and the town-centre HG1 sectors are the value end. If you are staying put, your home has broadly held its value, and the pull that supports Harrogate prices, the schools, the Stray and the direct trains to Leeds and London, has not gone anywhere. The supply side, including where the next decade of new homes may go, is covered in our Harrogate planning news page.
Frequently asked questions
What is the average house price in Harrogate?
The average sold price in Harrogate town is £397,640, from Land Registry records of sales in the year to April 2026. The wider HG postcode area, which includes Knaresborough and Ripon, averages £396,000.
Why does the official index show a much lower figure?
Because since April 2023 the local authority is the whole of North Yorkshire, England’s largest council area. The official UK House Price Index average of £270,320 (May 2026) covers everywhere from Skipton to Whitby, not just Harrogate.
Are Harrogate house prices going up or down?
Gently down at town level: sold prices in the year to April 2026 were about 3% below the year before, and about 1% below the 2023 peak. Across the HG postcode area prices edged up about 1% in the year to June 2026, and the county-wide official index rose 2.6% in the year to May 2026.
How much is a detached house in Harrogate?
About £677,667 on average in the year to April 2026, from Land Registry sold-price records. Across the wider HG area the detached average is £635,000.
Where are the most expensive houses in Harrogate?
South of the Stray and around the Duchy estate. Fulwith Mill Lane is the priciest street at an average of about £2.37 million, followed by Swan Road and Firs Road. The HG2 9 sector averages £706,000, the highest in the HG area.
Where can I check what a specific house sold for?
Every completed sale in England and Wales is public. Look up any street or address free on the HM Land Registry sold-price search.
Sources
- Rightmove house prices in Harrogate (Land Registry sold-price data, year to April 2026) for the town average, property-type averages and the 2023 peak.
- UK House Price Index, North Yorkshire (ONS / HM Land Registry) for the official county figures, buyer-type averages and annual change.
- UK HPI data service, North Yorkshire, May 2026 and England, May 2026 for the underlying index values.
- Plumplot Harrogate house prices (Land Registry data, year to June 2026) for the HG postcode-area averages, sales volumes and sector extremes.
- Property Solvers Harrogate house prices for the most expensive streets, time to sell and price reductions.
- HM Land Registry sold-price search to check any individual address.
Sold-price figures are provisional and revised as more sales complete. Each source above covers a slightly different area and period, which is why the averages differ; check the linked source before relying on a number.
Have your say